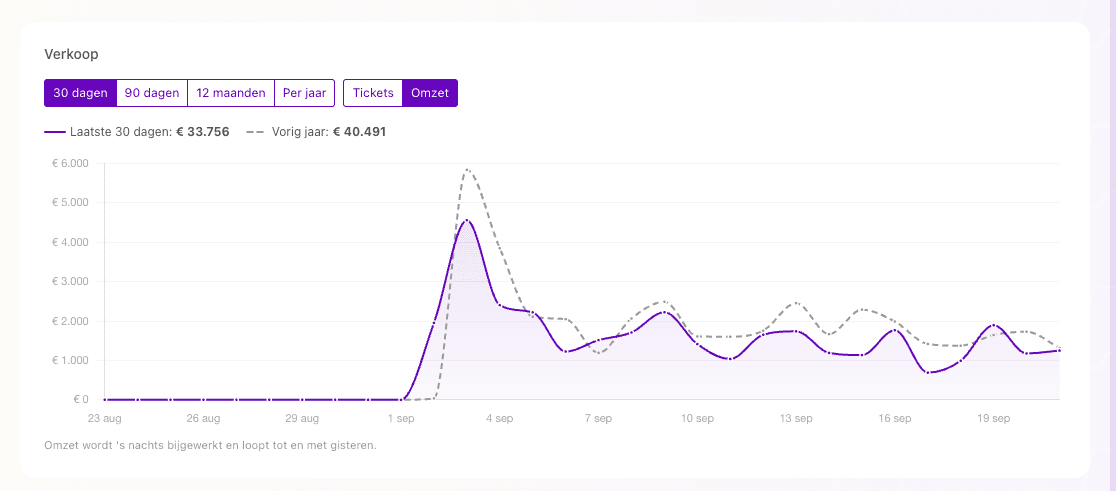
The sales chart on the Admin 2.0 dashboard has been expanded. You can now choose which period you want to view: 30 days, 90 days, 12 months or per year.
For 30 days, 90 days and 12 months, the same period from last year is shown as a comparison. This makes it easier to see how your sales are performing compared to last year.
The chart is also displayed wider on the dashboard, and the dashboard layout has been improved so the most important figures and sales insights are easier to view together.